Section 3: Drought

North Dakota is a semi-arid state. This means that the weather is neither consistently desert-like (arid), nor humid. But, in any given year, the weather may be desert-like or very wet. The weather in our state is likely to be extreme in one direction or the other.
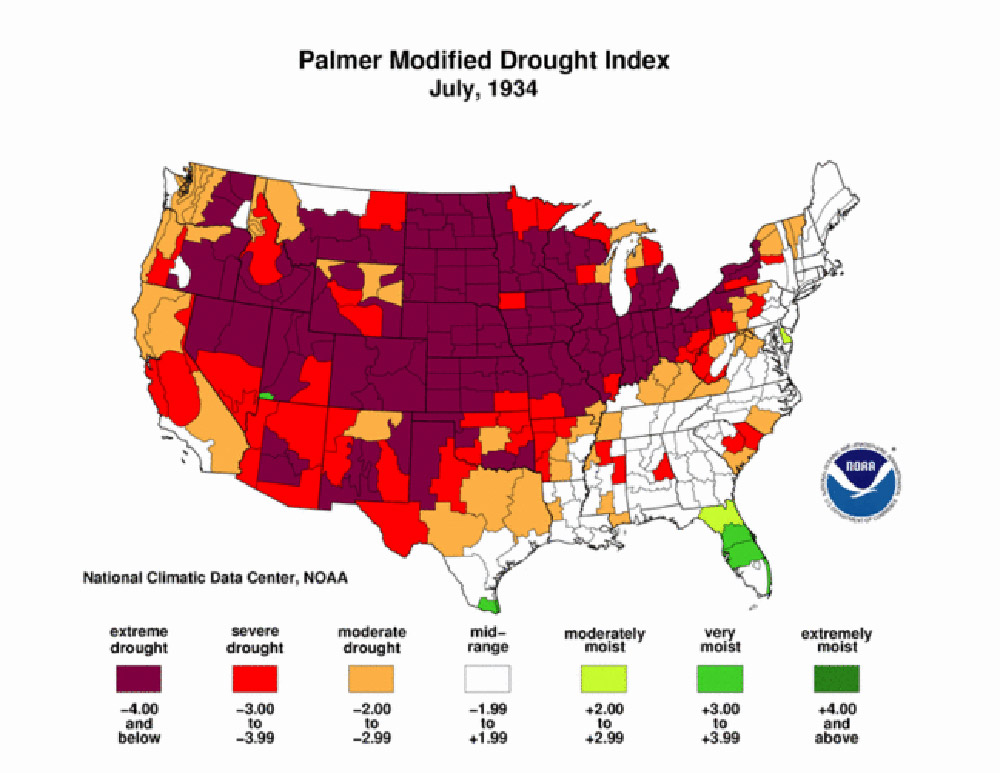
0075-0060
Image 4:This field of corn shows the impact of severe, long-term drought. Most of the seed sprouted, but the plants did not grow properly. Much of the soil is exposed to wind and water erosion. SHSND 0075-0060

 
Palmer Maps, 1930s. These Palmer Z-Index maps show areas of North Dakota that suffered from drought during the 1930s. Map 8 is a Palmer Modified Drought Index Map for July 1934 showing the effect of drought over the past 12 months. Palmer Maps, 1930s. These Palmer Z-Index maps show areas of North Dakota that suffered from drought during the 1930s. Map 8 is a Palmer Modified Drought Index Map for July 1934 showing the effect of drought over the past 12 months. Palmer Maps, 1930s. These Palmer Z-Index maps show areas of North Dakota that suffered from drought during the 1930s. Map 8 is a Palmer Modified Drought Index Map for July 1934 showing the effect of drought over the past 12 months. Palmer Maps, 1930s. These Palmer Z-Index maps show areas of North Dakota that suffered from drought during the 1930s. Map 8 is a Palmer Modified Drought Index Map for July 1934 showing the effect of drought over the past 12 months. Palmer Maps, 1930s. These Palmer Z-Index maps show areas of North Dakota that suffered from drought during the 1930s. Map 8 is a Palmer Modified Drought Index Map for July 1934 showing the effect of drought over the past 12 months. Palmer Maps, 1930s. These Palmer Z-Index maps show areas of North Dakota that suffered from drought during the 1930s. Map 8 is a Palmer Modified Drought Index Map for July 1934 showing the effect of drought over the past 12 months. Palmer Maps, 1930s. These Palmer Z-Index maps show areas of North Dakota that suffered from drought during the 1930s. Map 8 is a Palmer Modified Drought Index Map for July 1934 showing the effect of drought over the past 12 months. Palmer Maps, 1930s. These Palmer Z-Index maps show areas of North Dakota that suffered from drought during the 1930s. Map 8 is a Palmer Modified Drought Index Map for July 1934 showing the effect of drought over the past 12 months.
 
0281-0066
Image 5: Drought is often accompanied by insect infestations. During the severe drought of the 1930s, clouds of grasshoppers lit wherever they could find something to eat. Once the crops were gone, the grasshoppers ate clothing hanging out to dry, broom handles, or tree bark. When the grasshoppers had eaten everything they could find, the swarm flew off to another spot. Clouds of grasshoppers were thick enough to darken the daytime sky. SHSND 0281-0066.

 
Palmer Maps, 1984-2011. These Palmer Z-Index maps indicate that drought appears periodically in North Dakota, but often is very localized. The map of 2011, shows the excess rainfall that resulted in flooding in the Missouri, Mouse, and Red River valleys. Palmer Maps, 1984-2011. These Palmer Z-Index maps indicate that drought appears periodically in North Dakota, but often is very localized. The map of 2011, shows the excess rainfall that resulted in flooding in the Missouri, Mouse, and Red River valleys. Palmer Maps, 1984-2011. These Palmer Z-Index maps indicate that drought appears periodically in North Dakota, but often is very localized. The map of 2011, shows the excess rainfall that resulted in flooding in the Missouri, Mouse, and Red River valleys. Palmer Maps, 1984-2011. These Palmer Z-Index maps indicate that drought appears periodically in North Dakota, but often is very localized. The map of 2011, shows the excess rainfall that resulted in flooding in the Missouri, Mouse, and Red River valleys.
 
2012-P-006-09
Image 6: Drought destroyed native and cultivated grasses leaving nothing for livestock. During the 1930s, the federal government bought many head of starved cattle for as little as $2 per head. If the animals were strong enough to withstand a trip to market they were slaughtered for canned meat to be used in feeding the poor. If they could not make the trip, they were often shot near a burial pit in their county after the farmer was paid a small amount. Though farmers protested the slaughter and the low prices, they had to face the fact that they had no feed for their cattle. SHSND 2012-P-006-09.

 
2012-P-006-12
Image 7: Drought left the soil exposed to wind and rain erosion. The hot, dry winds of the 1930s blew good topsoil as far east as the Atlantic Ocean. Soil also drifted into fences where it stopped in a pile with tumbleweeds and other weedy vegetation. SHSND 2012-P-006-12


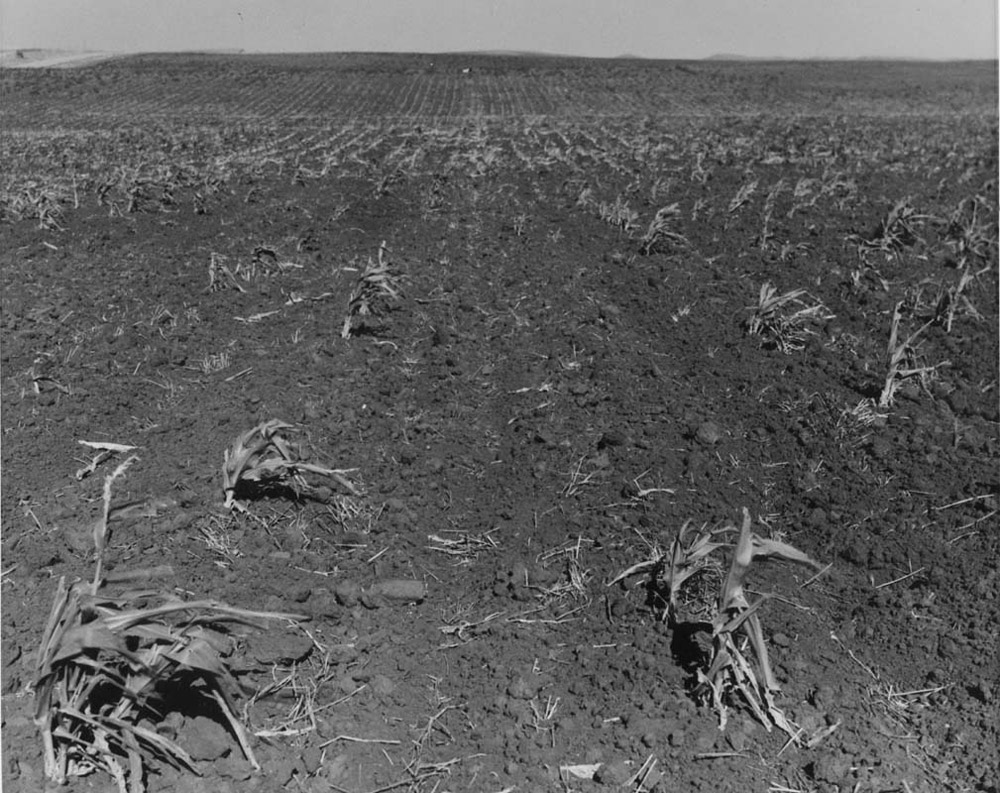
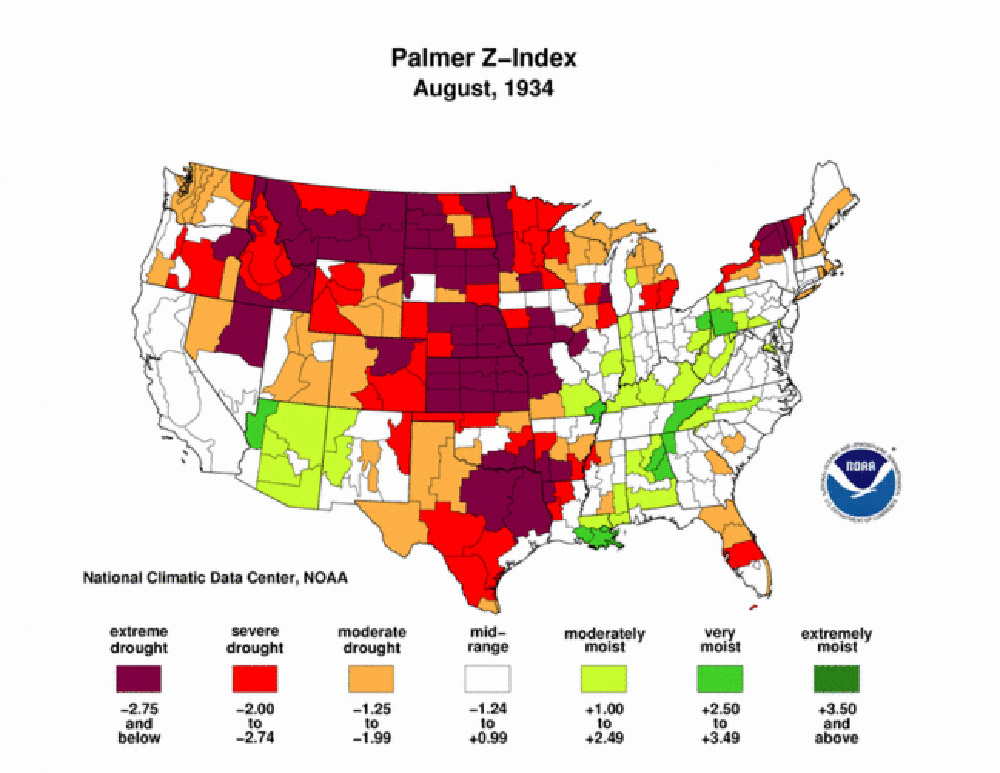
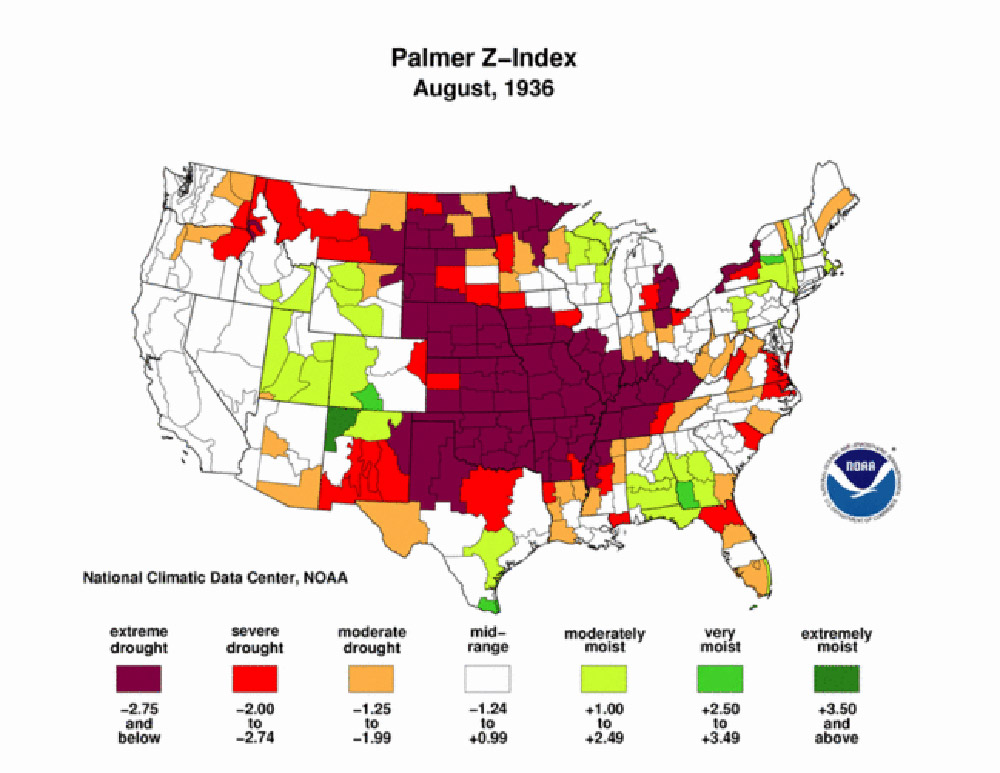
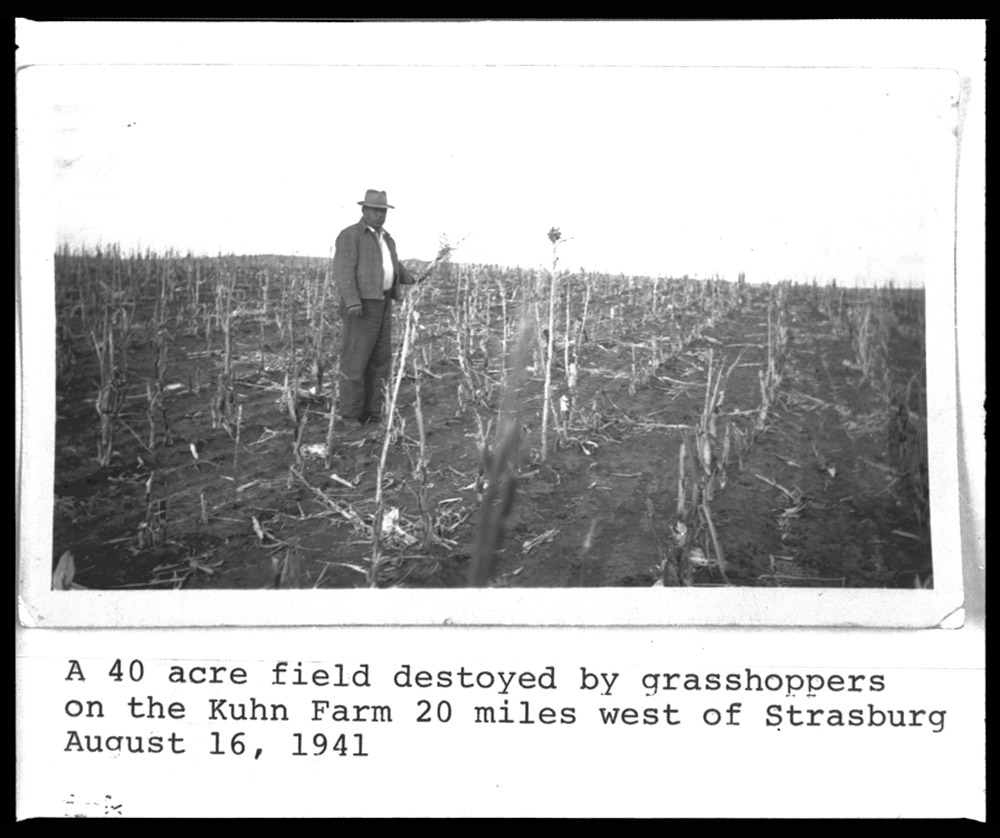
During the mid-1930s, drought combined with heat to kill farm crops and leave livestock with little to eat. (See Image 4.) In 1936, North Dakota recorded both its record highest temperature and its record lowest temperature. Steele recorded a high temperature of 121° F on July 6, 1936. It was 114°F in Bismarck the same day. (See Maps 1-8.) However, just five months earlier, on February 15, 1936, the thermometer read -60°F in Parshall. That gives North Dakota a temperature spread of 181 degrees. (See Image 5.) Only two other states have more extreme temperatures: Montana (187 degrees) and Utah (186 degrees).

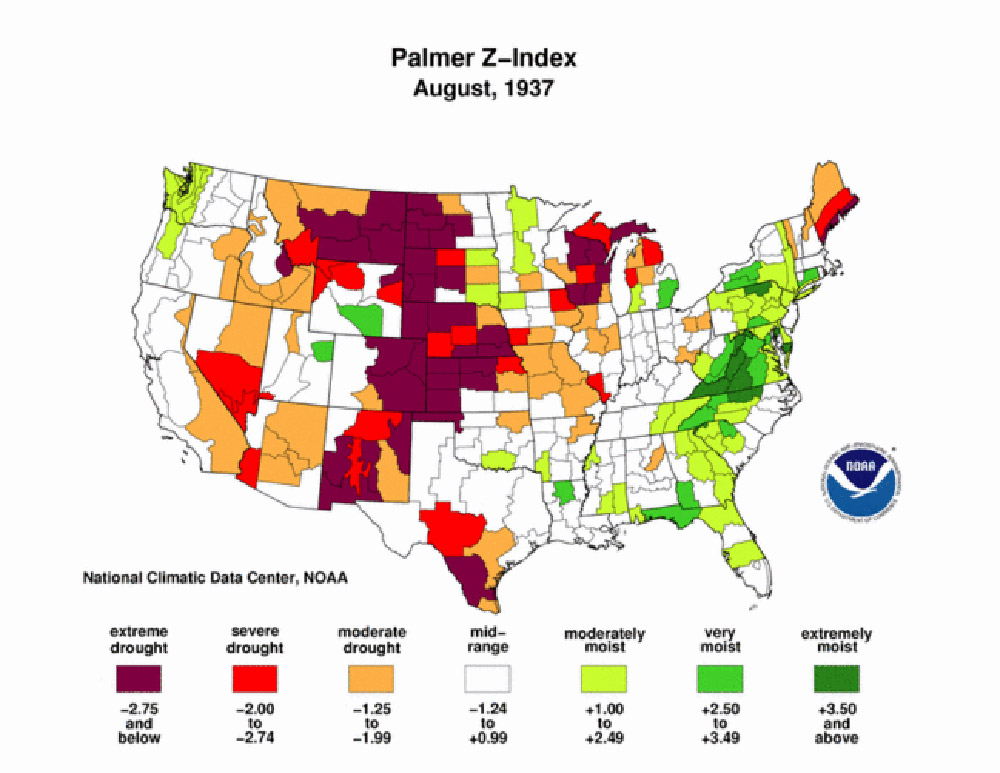
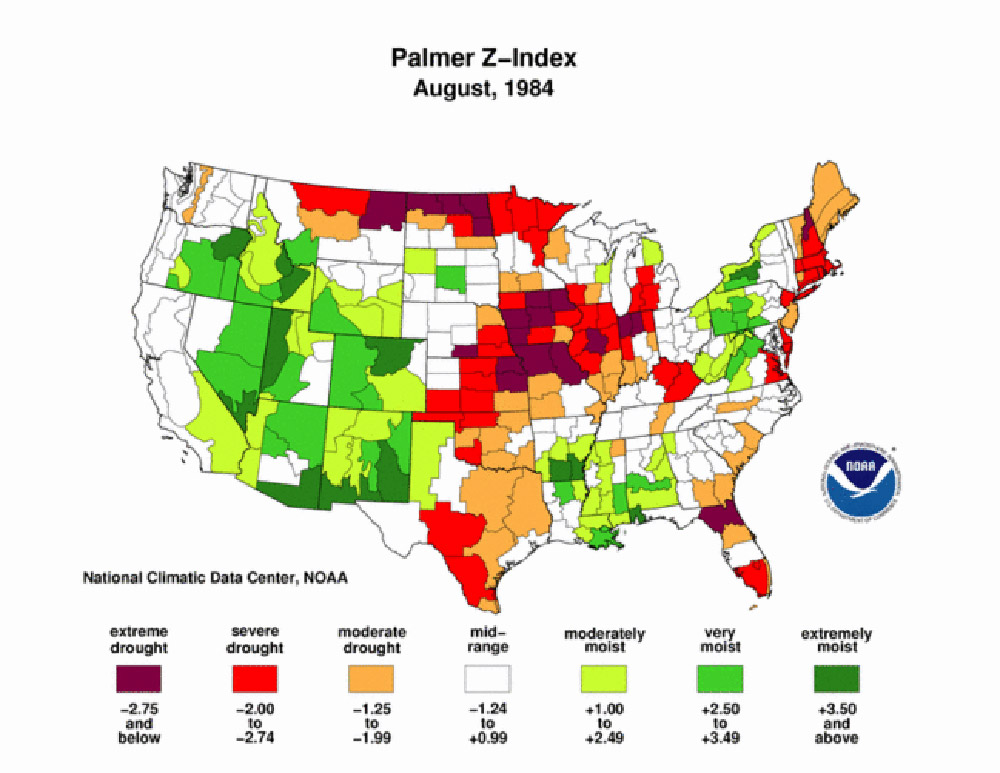
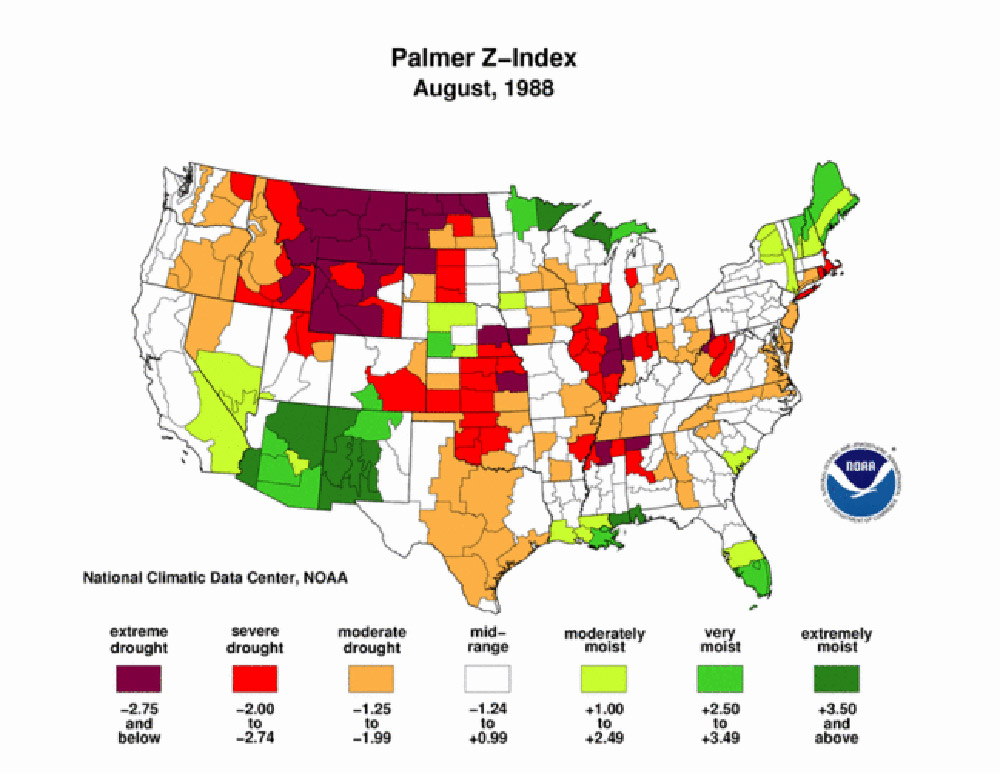
Of course, the 1930s were not the only drought years in North Dakota. Because our climate is semi-arid, drought can be expected at any time. (See Maps 9-12.) Drought might strike one part of the state, but not another. This is a constant problem for farmers. (See Image 6.) When you see stacks of hay bales in a farm yard, they represent the farmers’ protection against a hay-destroying drought. No-tillNo-till refers to an agricultural practice in which farmers do not till the soil after harvest or before planting. Farmers use equipment that drills the seed into the ground without disturbing the soil surface. In this way, the moisture that is stored in the sub-surface soil layers cannot easily evaporate. Tillage not only allows moisture to escape, it destroys the physical structure of the soil. No-till helps to preserve or restore the best qualities of the soil. farming practices help to conserve soil moisture which is another protection against drought.

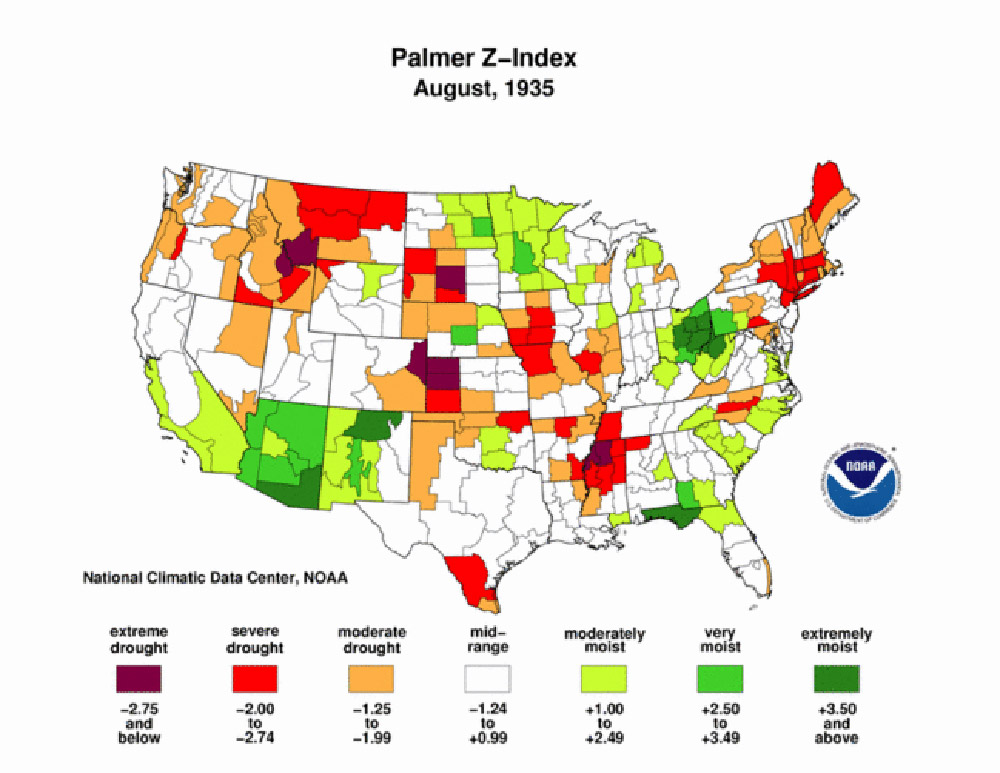
The effects of a string of dry, hot summers cannot be overcome by a single wetter than usual year. In 1935, North Dakota farmers had more rain than usual, but the rainfall did not end the drought that lasted until the end of the decade. Nor do the effects of long-term drought yield to irrigation or conservation practices. After years of below-normal rain or snowfall, the moisture in the lower levels of the soil becomes depleted. Seeds may not sprout. (See Image 7.) Exposed topsoil blows away in the wind. Prairie fires can start easily in dry brush and burn until they run out of fuel.

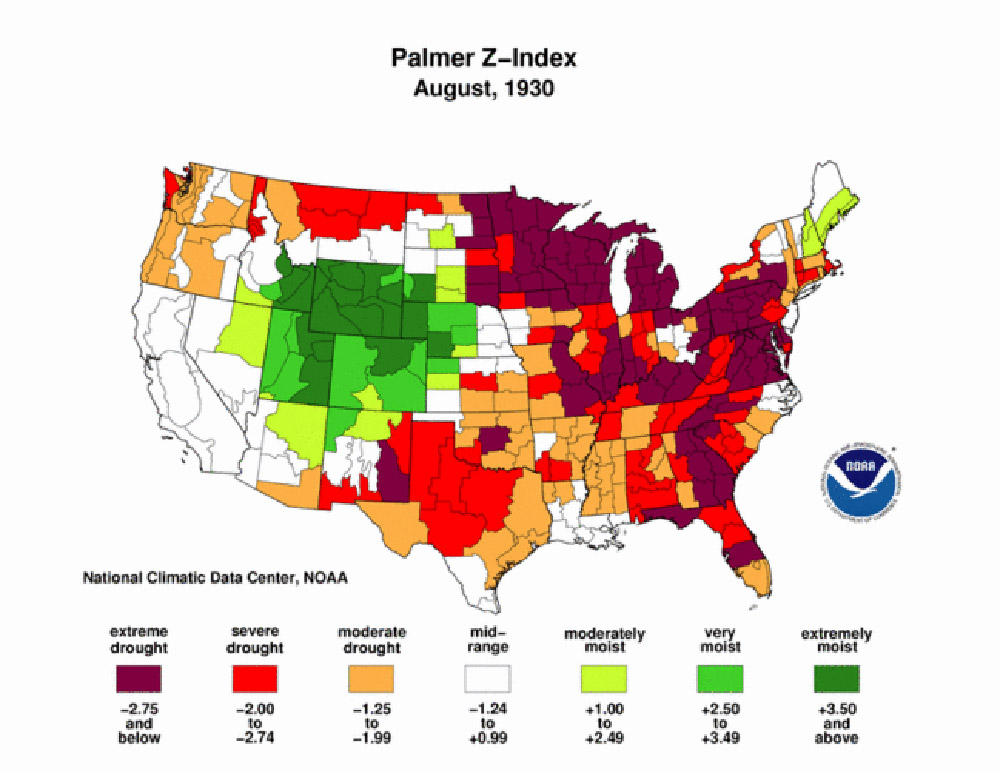
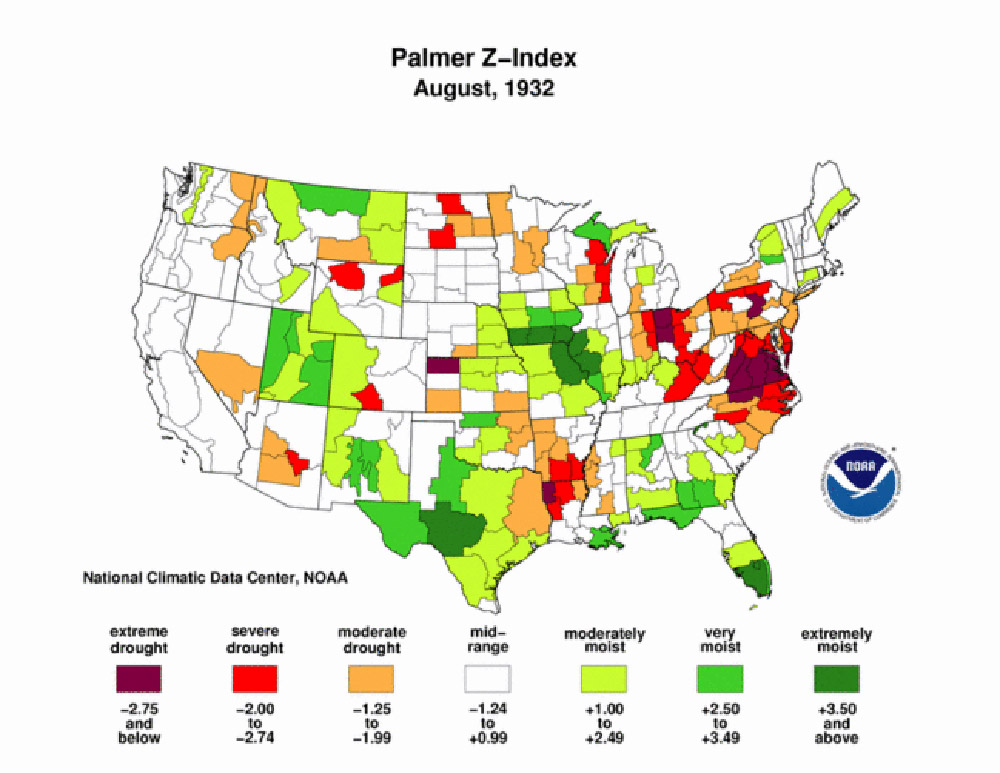
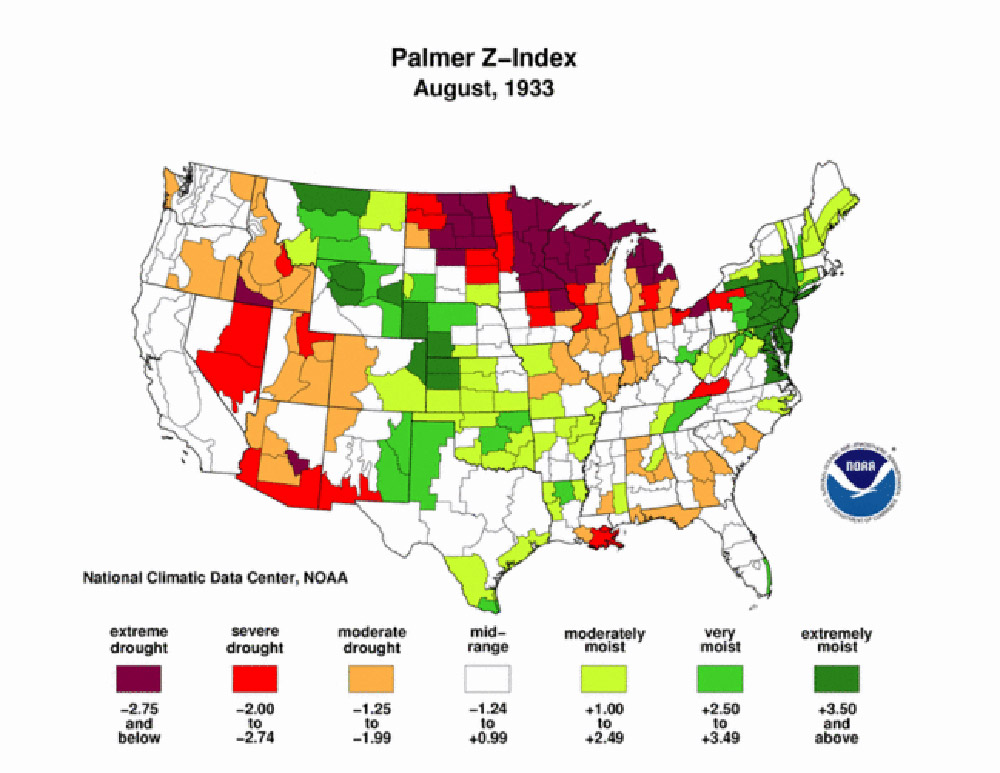
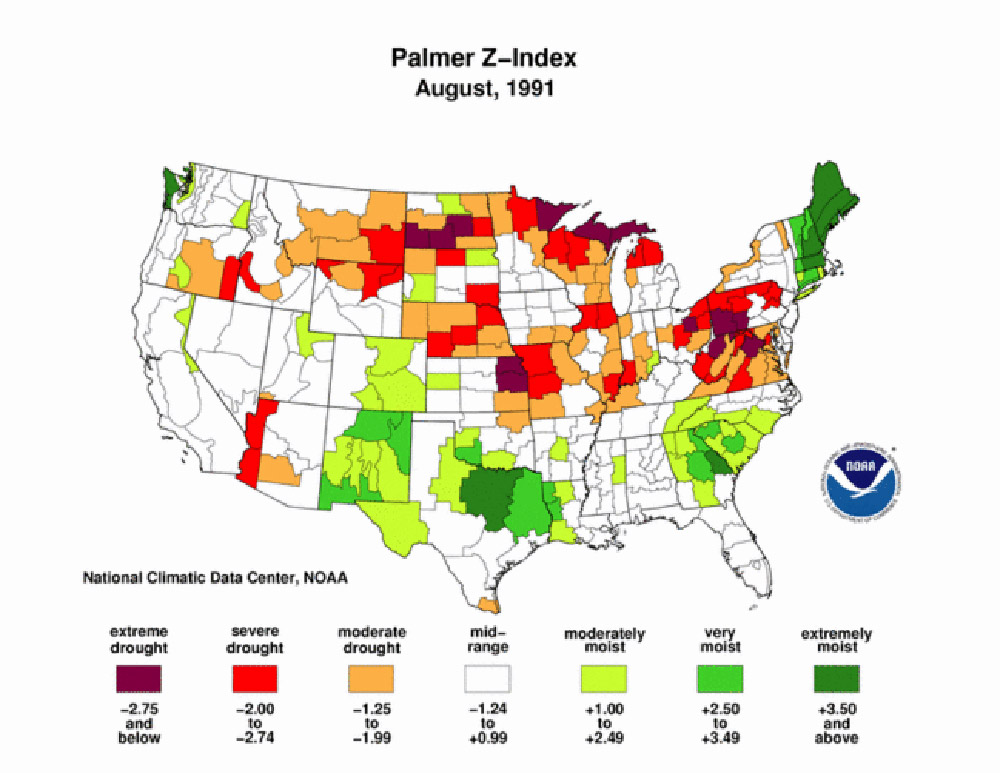
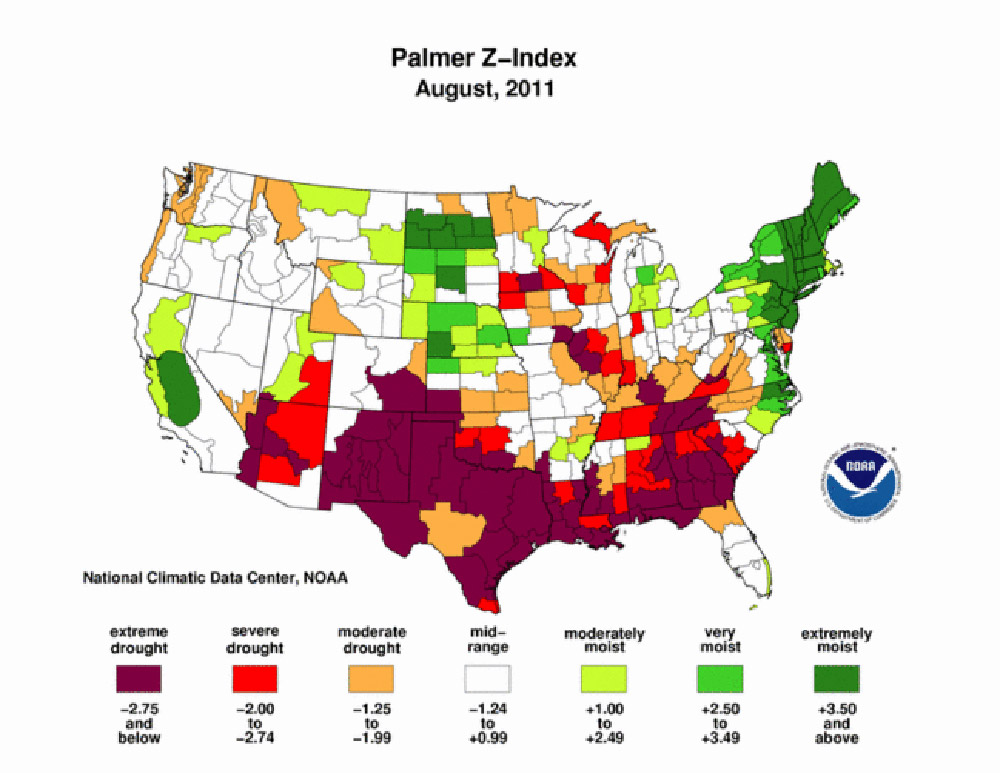
The maps included here are from the National Oceanic and Atmospheric Administration (NOAA) website. They were developed with a tool called the Palmer Drought Severity Index.

Why is this important? Drought is a recurring climatological problem in North Dakota. We can’t change the climate, but we can prepare for it and understand the impact of drought on agriculture. Drought combined with heat can affect both soil moisture and surface water resources (such as lakes and rivers). Because we live in a semi-arid state, it is important to practice water conservation in both agriculture and in daily life.