


North Dakota’s population decreased steadily since it reached a peak of 680,845 in 1930 until about 2015. There were a few years when the federal census found a slight rise in the population, but for many years after 1930, the population declined. (See Chart 1.)
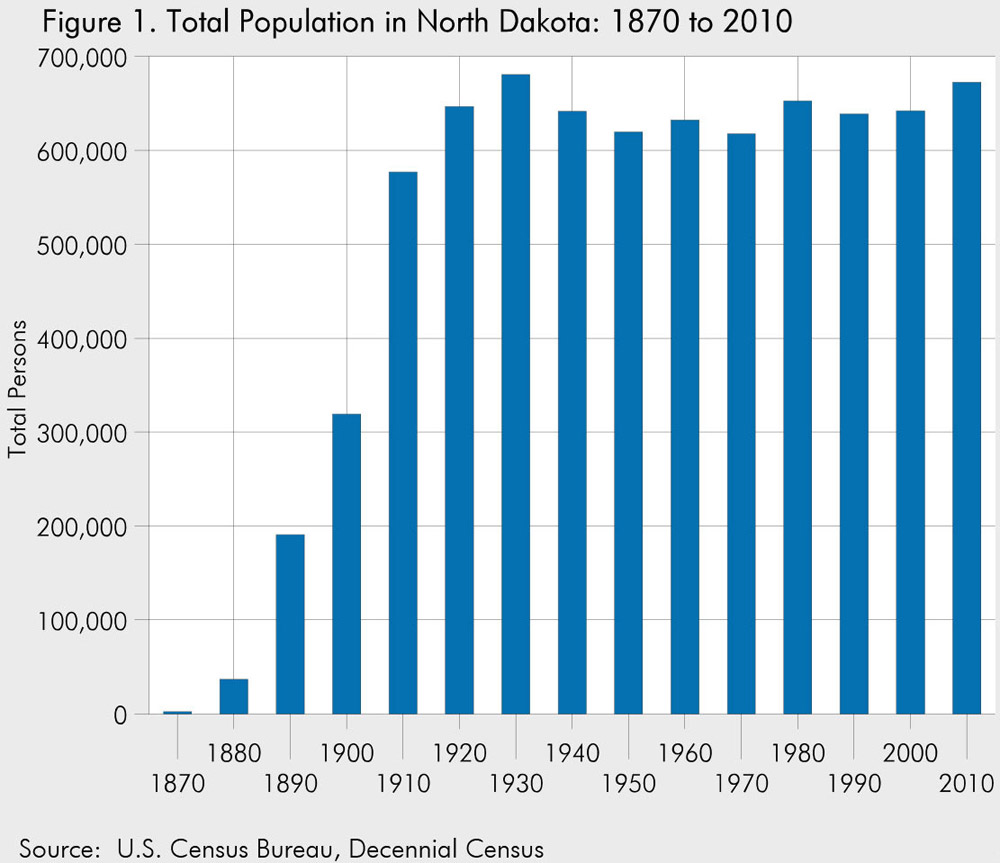
Oil exploration and development led to a population increase in 1980. But as the first oil boom faded, the population declined again. The 2010 census showed another increase, again due to the impact of oil and gas development. In 2010, North Dakota had a population of 672,591, only a few thousand short of the 1930 census.In 2017, the population reached a new peak of 755,393. The federal census is required by the Constitution of the United States. Every ten years (in the zero year), the U.S. Census Bureau mails census questionnaires to every home. Workers also try to count people who don’t have homes. The census helps the federal and state governments know how to plan for highways, schools, and services. In 2017, the population reached a new peak of 755,393.
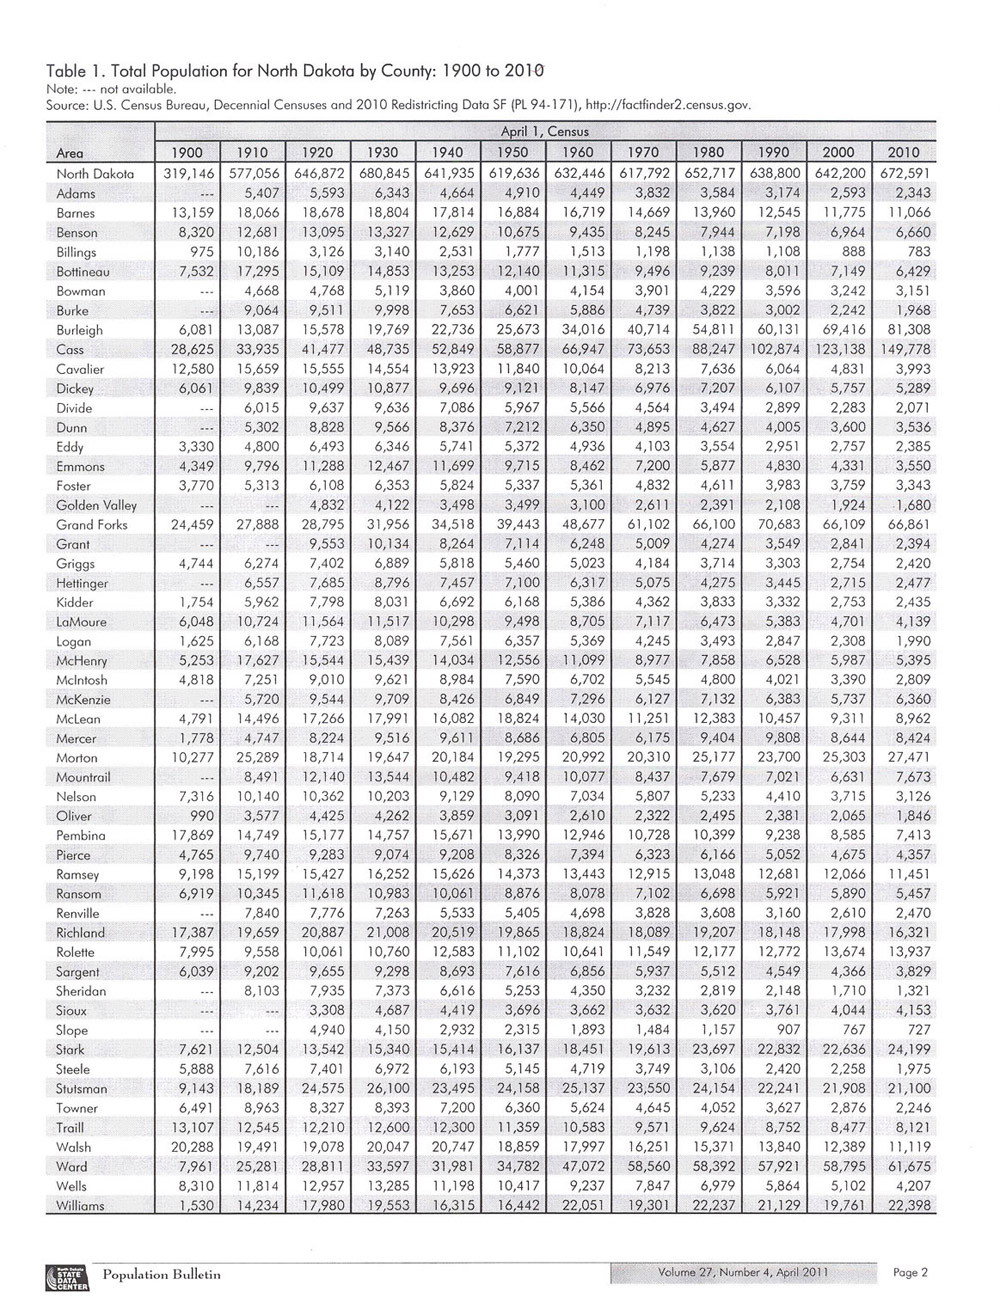
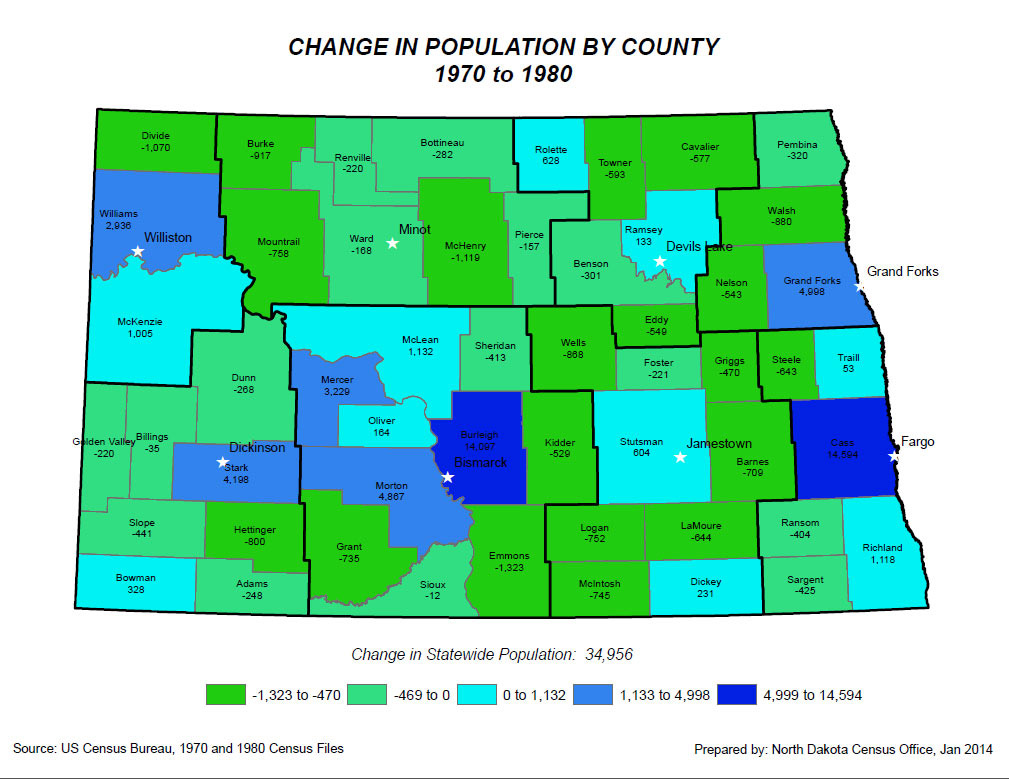
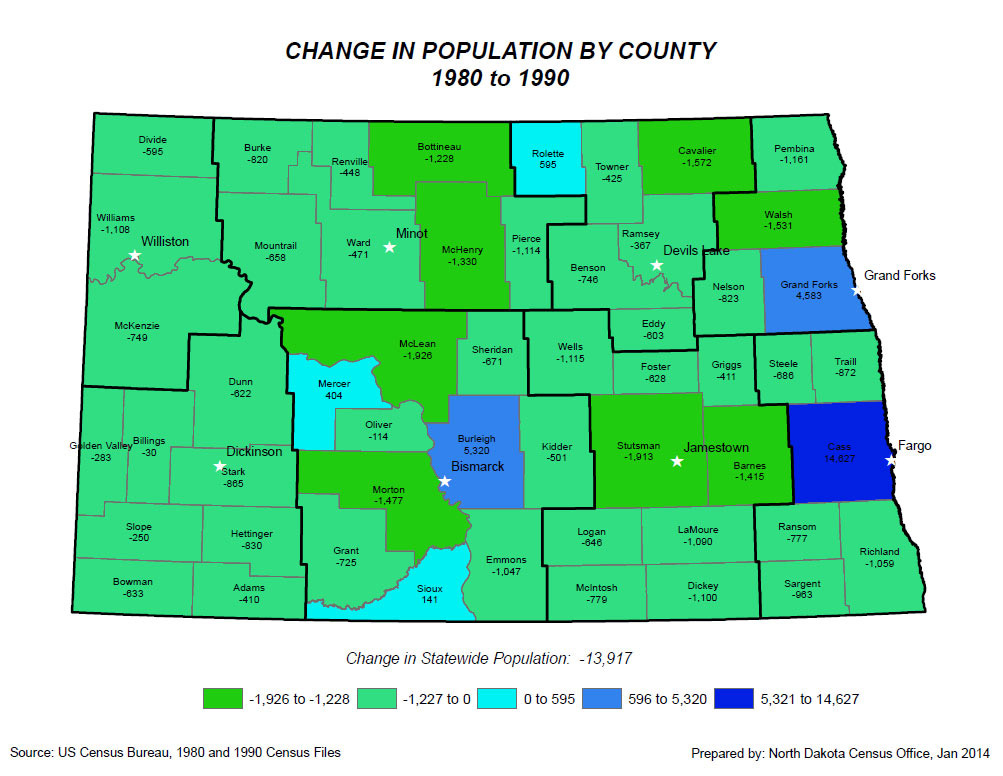
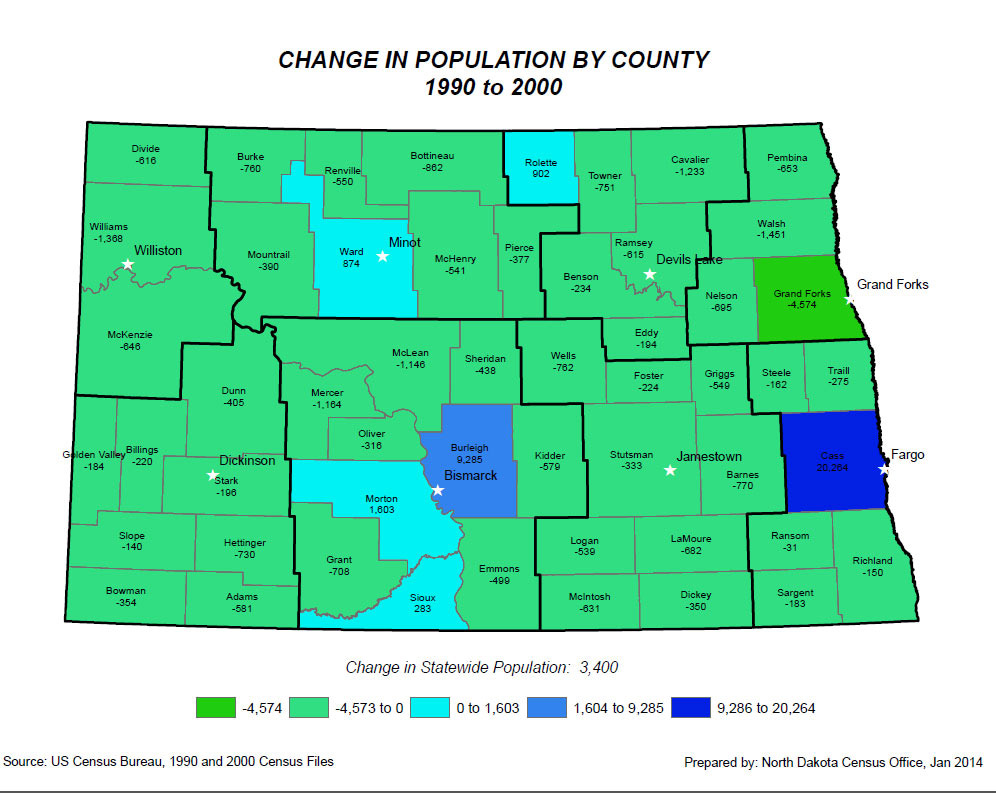
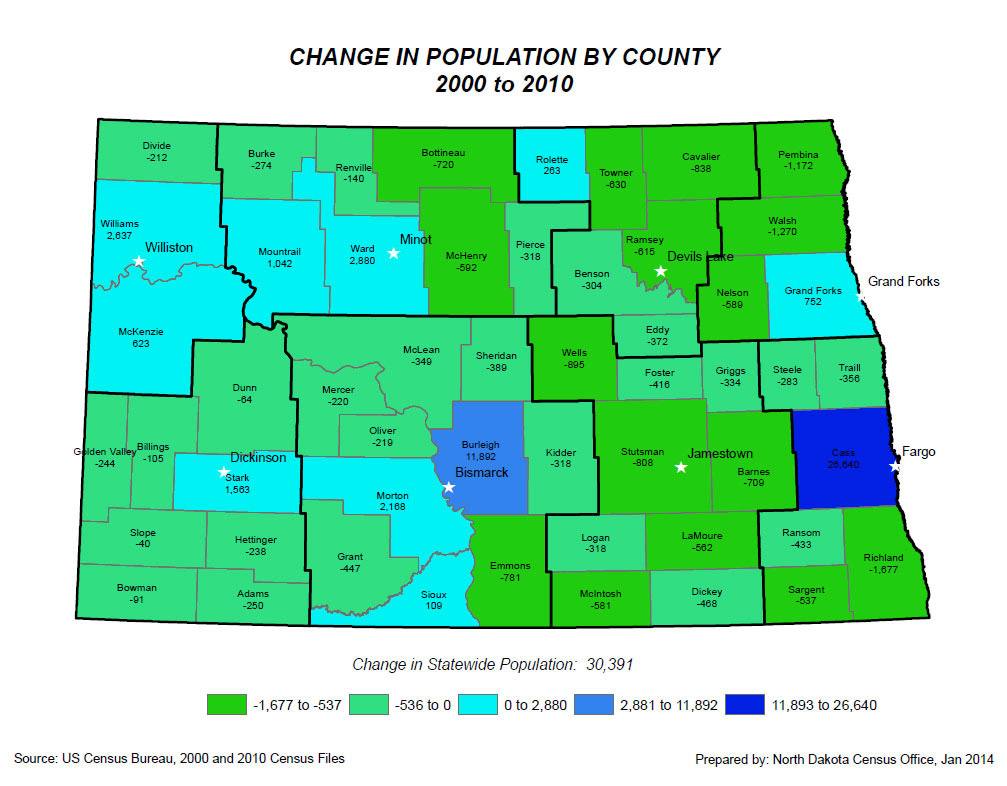


If we take a closer look at the population charts and maps, we can see that population growth and decline do not take place evenly across the state. (See Maps 4, 5, 6, and 7.) Some counties have grown in recent decades, while other counties have lost population. All of the major cities have seen increases in population. Small towns, particularly in the eastern half of the state, have felt the loss of population most keenly.
Oil is not the only “push” factor in population growth. A close analysis of the oil-rich counties suggests that oil workers have moved to North Dakota from somewhere else. On the other hand, American Indian populations are increasing because the population is younger. A young population increases by births. The American Indian population is increasing almost three times faster than the general population of the United States. The median age of American Indians is 31.3 years old. The median age of all Americans is 37.3 years old. American Indian populations (and reservations) will continue strong growth because the median age of American Indians is relatively young.
We can also observe population growth in North Dakota’s cities. Today, about one-sixth of the state’s population lives in Cass County. (See Chart 2.) Most of those people live in Fargo. Other counties with major cities are also seeing an increase in population. Grand Forks, Ward, Burleigh, and Stark counties are growing as people move into cities for work, education, or retirement. The population of the state, counties, and cities changes frequently. To keep up with these changes refer to documents at the North Dakota Department of Commerce. The population of the state, counties, and cities changes frequently. To keep up with these changes refer to document at North Dakota Department of Commerce
Why is this important? So many things depend on the size and growth of a city or county population. Schools must have an adequate number of students and an adequate number of tax-paying households in the school district. in order to meet teachers’ salaries and maintain the school buildings. The maintenance of highways also depends on how many cars and trucks use the highways. All government services depend on a reliable population base.
Sudden growth, however, can be difficult, too. Government officials and voters need to decide if the growth is permanent. Then, they have to decide how to spend money to serve the growing population. Growing towns have to expand schools, medical facilities, housing, sewage systems, fresh water systems, streets, and police services. Figuring out how to do all of that all at once is a challenge.
In a little more than a century, North Dakota’s population has gone from boom to bust and back to boom. We know that everything will change again. Information will help us deal with the change.