


The second supporting question, “How has the availability of oil and natural gas influenced the North Dakota economy?” helps students use sources to unwrap the context of the time and topic being examined. Complete the following task using the sources provided to build a context of the time period and topic being examined.
Formative Performance Task 2
Create a timeline of major events, changes, and innovations in U.S. and world history that have had an impact on the oil and natural gas industry in North Dakota. When were oil and natural gas discovered in North Dakota? What were some of the bigger issues and trends of the oil and gas industry in North Dakota? What are reclamation and regulation policies and how do they effect the cultural and natural resources of the state? What technological changes, trends, and other issues are influencing the oil and gas sector in North Dakota today?
Featured Sources 2
In the early twentieth century, many people speculated that North Dakota’s soil could produce more than just wheat. Mineral rights and oil leases began changing hands in an uncertain market. Tom Leach was one of North Dakota’s leading independent oil geologists. He convinced the Amerada Oil Company to drill in eastern Williams County near Tioga. On April 4, 1951, drillers at the Clarence Iverson Number 1 struck oil. With this discovery, North Dakota opened its oil patch in the Williston Basin. Production of the early oil fields peaked in 1982 and then began a decline that left some towns desperate to fill empty houses and schools built during the boom. In 2007, news about the Bakken formation brought high hopes back to the West River country. By 2008 the Williston Basin had produced more than 5 billion barrels of oil in North Dakota, Montana, South Dakota, Saskatchewan, and Manitoba. Search the internet to find the most recent statistics of how many barrels of oil the Bakken has produced.
Study featured sources A-H. In a group or as a class, answer the following questions: What type of sources are they (letters, photos, maps, diaries, etc.)? What kind of information do they contain? Who created each of these sources? Who was the intended audience for each source? Why were these sources created? When were the sources created? What do the sources tell us about energy development during that time? How do we know? What else can you find? Study the sources for evidence of boom-and-bust cycles and how these affected different communities. Identify specific sentences and statistics that support your findings.
For source A, study the reports on oil production in North Dakota over the course of three decades. The statistics presented in this document set were taken from a small publication titled Oil Statistics 1989 which was published by the North Dakota Association of Oil and Gas Producing Counties as a project of the state’s centennial. These few pages of statistics indicate the change in oil production in twenty-three counties from 1950 to 1983. What does this information tell us? Which counties in North Dakota are oil producing? Can you find them on a map? What do the rows of numbers mean in these charts? Compare the number of oil rigs to the production numbers. How do the production figures relate to the number of rigs? What can be inferred from this data? Which county had the highest production in each year? What was the peak production year? Why do you think production began to decline? The state legislature taxed production on the wells, and producing wells located on state land paid a lease fee. Two documents presented here for the month of August 1954 indicate that $1,012.51 in taxes was paid to the state from Amerada Oil Co. Each well also paid leases to the State Land Office as indicated on Form 13 S.O.P. 7-51. These sources are part of SHSND Main Collection 338.27282 039 1989.
| Source A | 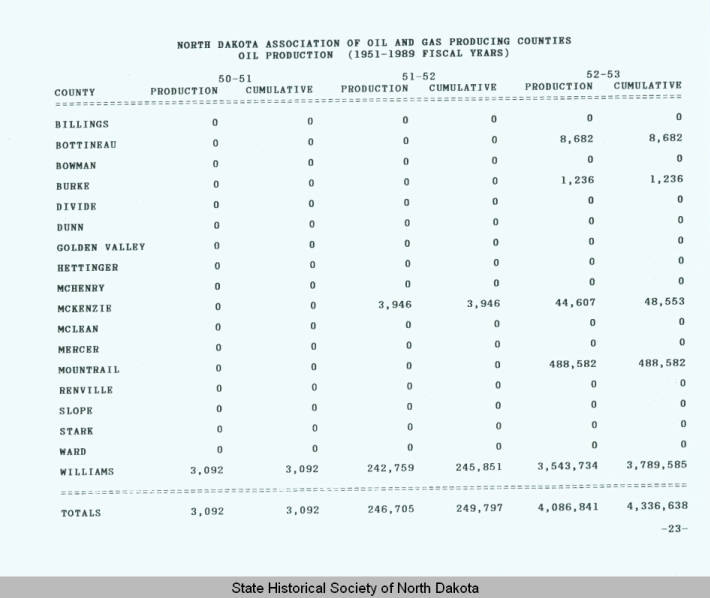
http://www.digitalhorizonsonline.org/digital/collection/uw-ndshs/id/3074 |
| Source B | 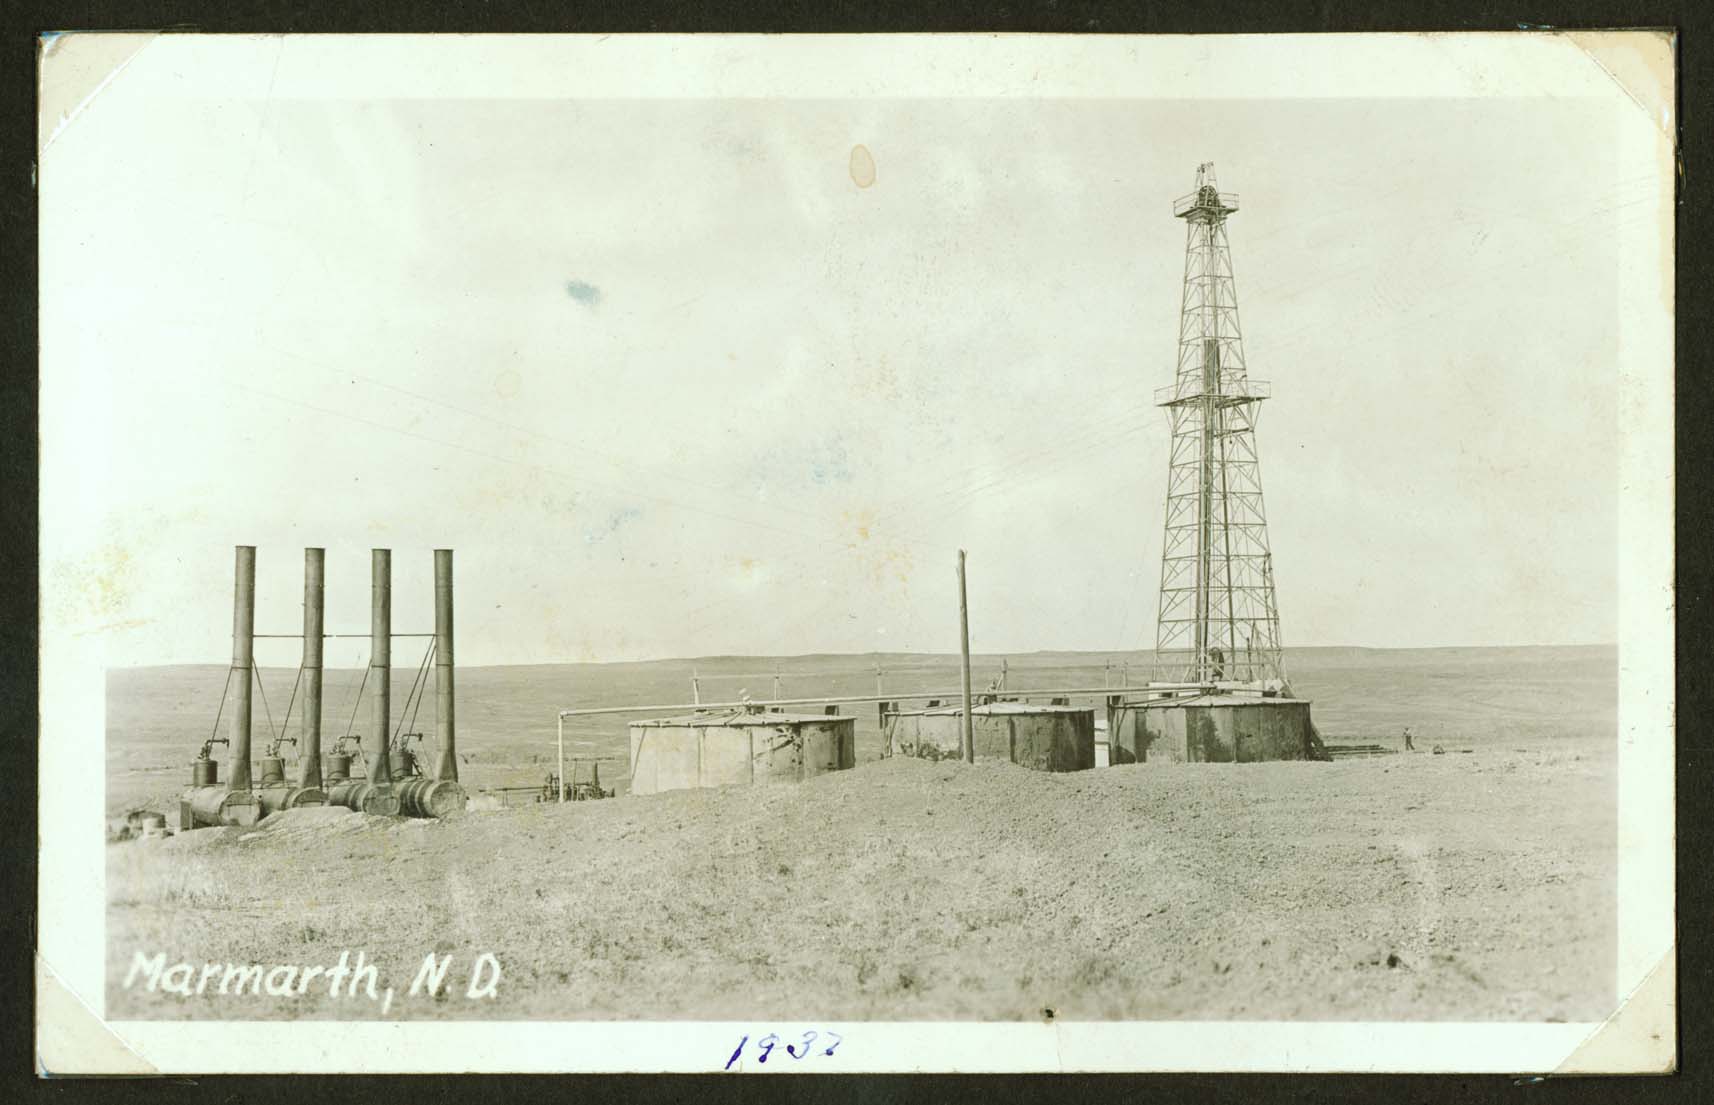
This successful oil well near Marmarth operated in 1937. Though a few wells operated before the opening of the Williston Basin at Tioga, they did not have the long-range success of the later wells. Today the oil fields near Marmarth are busy again. SHSND #2003-P-10-0003b. |
| Source C | 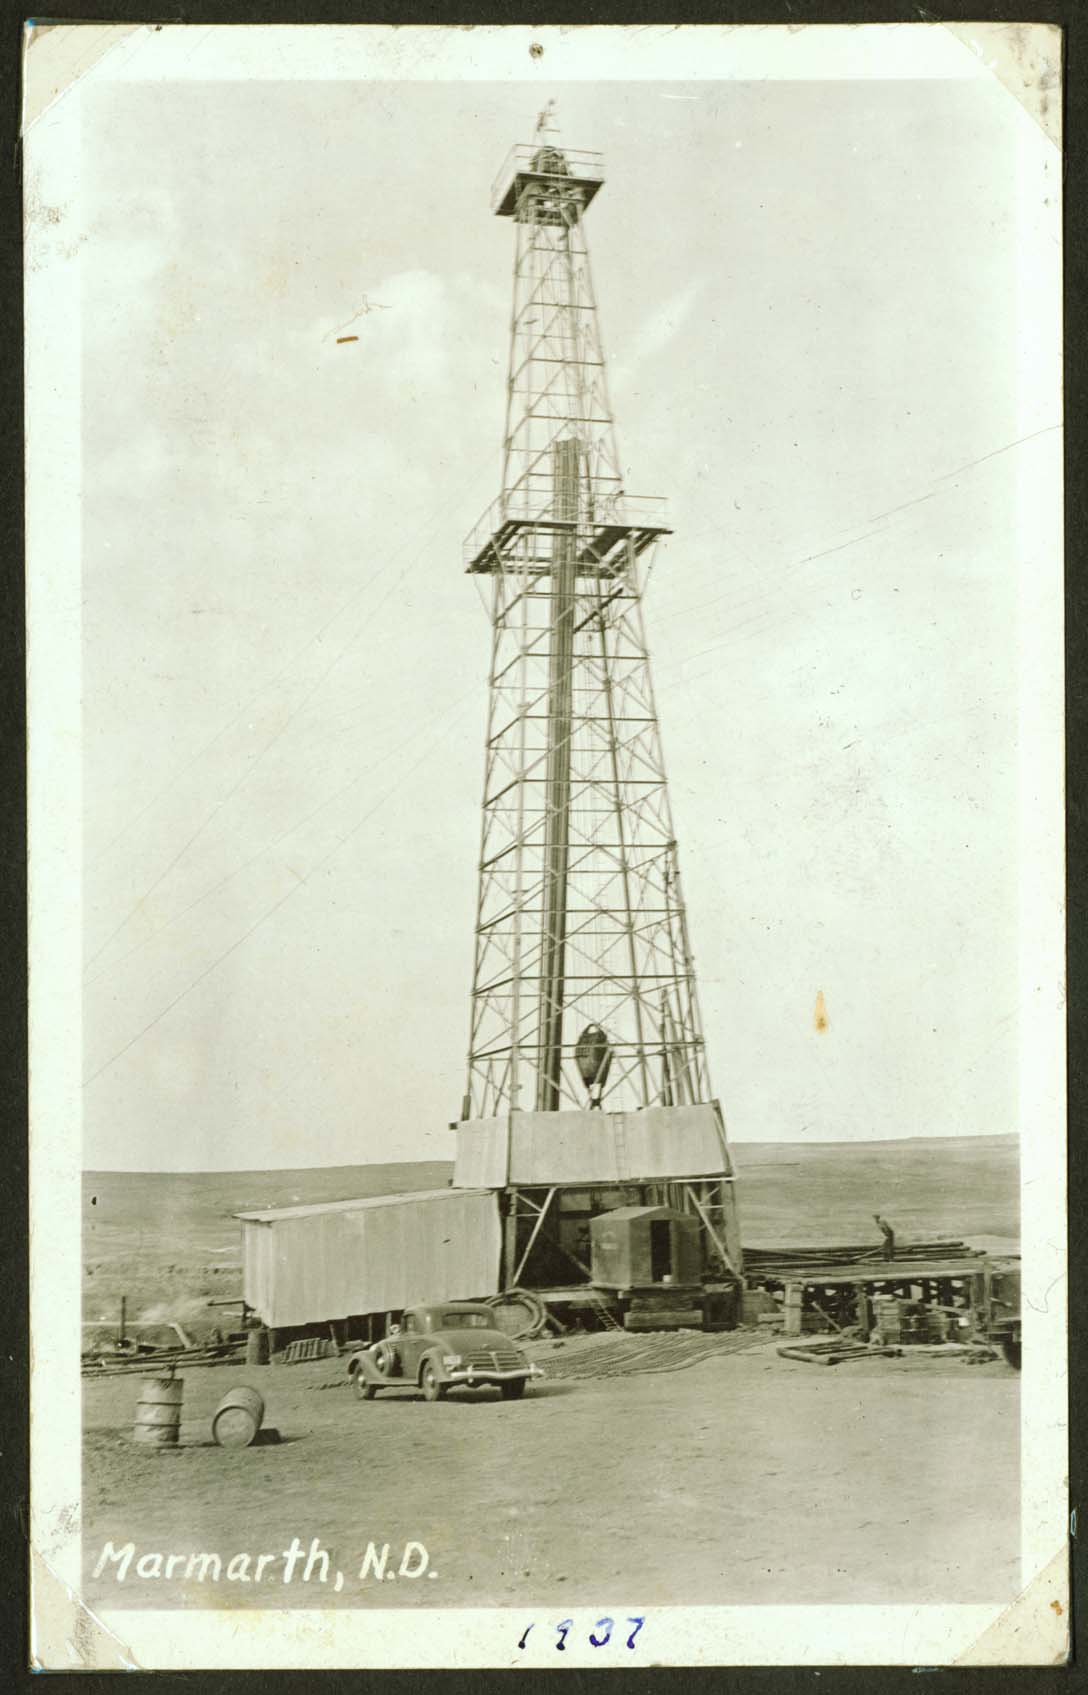
|
| Source D | 
This drill rig brought in the Clarence Iverson Number 1 oil well in April 1951. SHSND #0284-179. |
| Source E | 
This rig was among many that began the search for oil after the success of the Clarence Iverson #1. SHSND #A3768. |
| Source F | 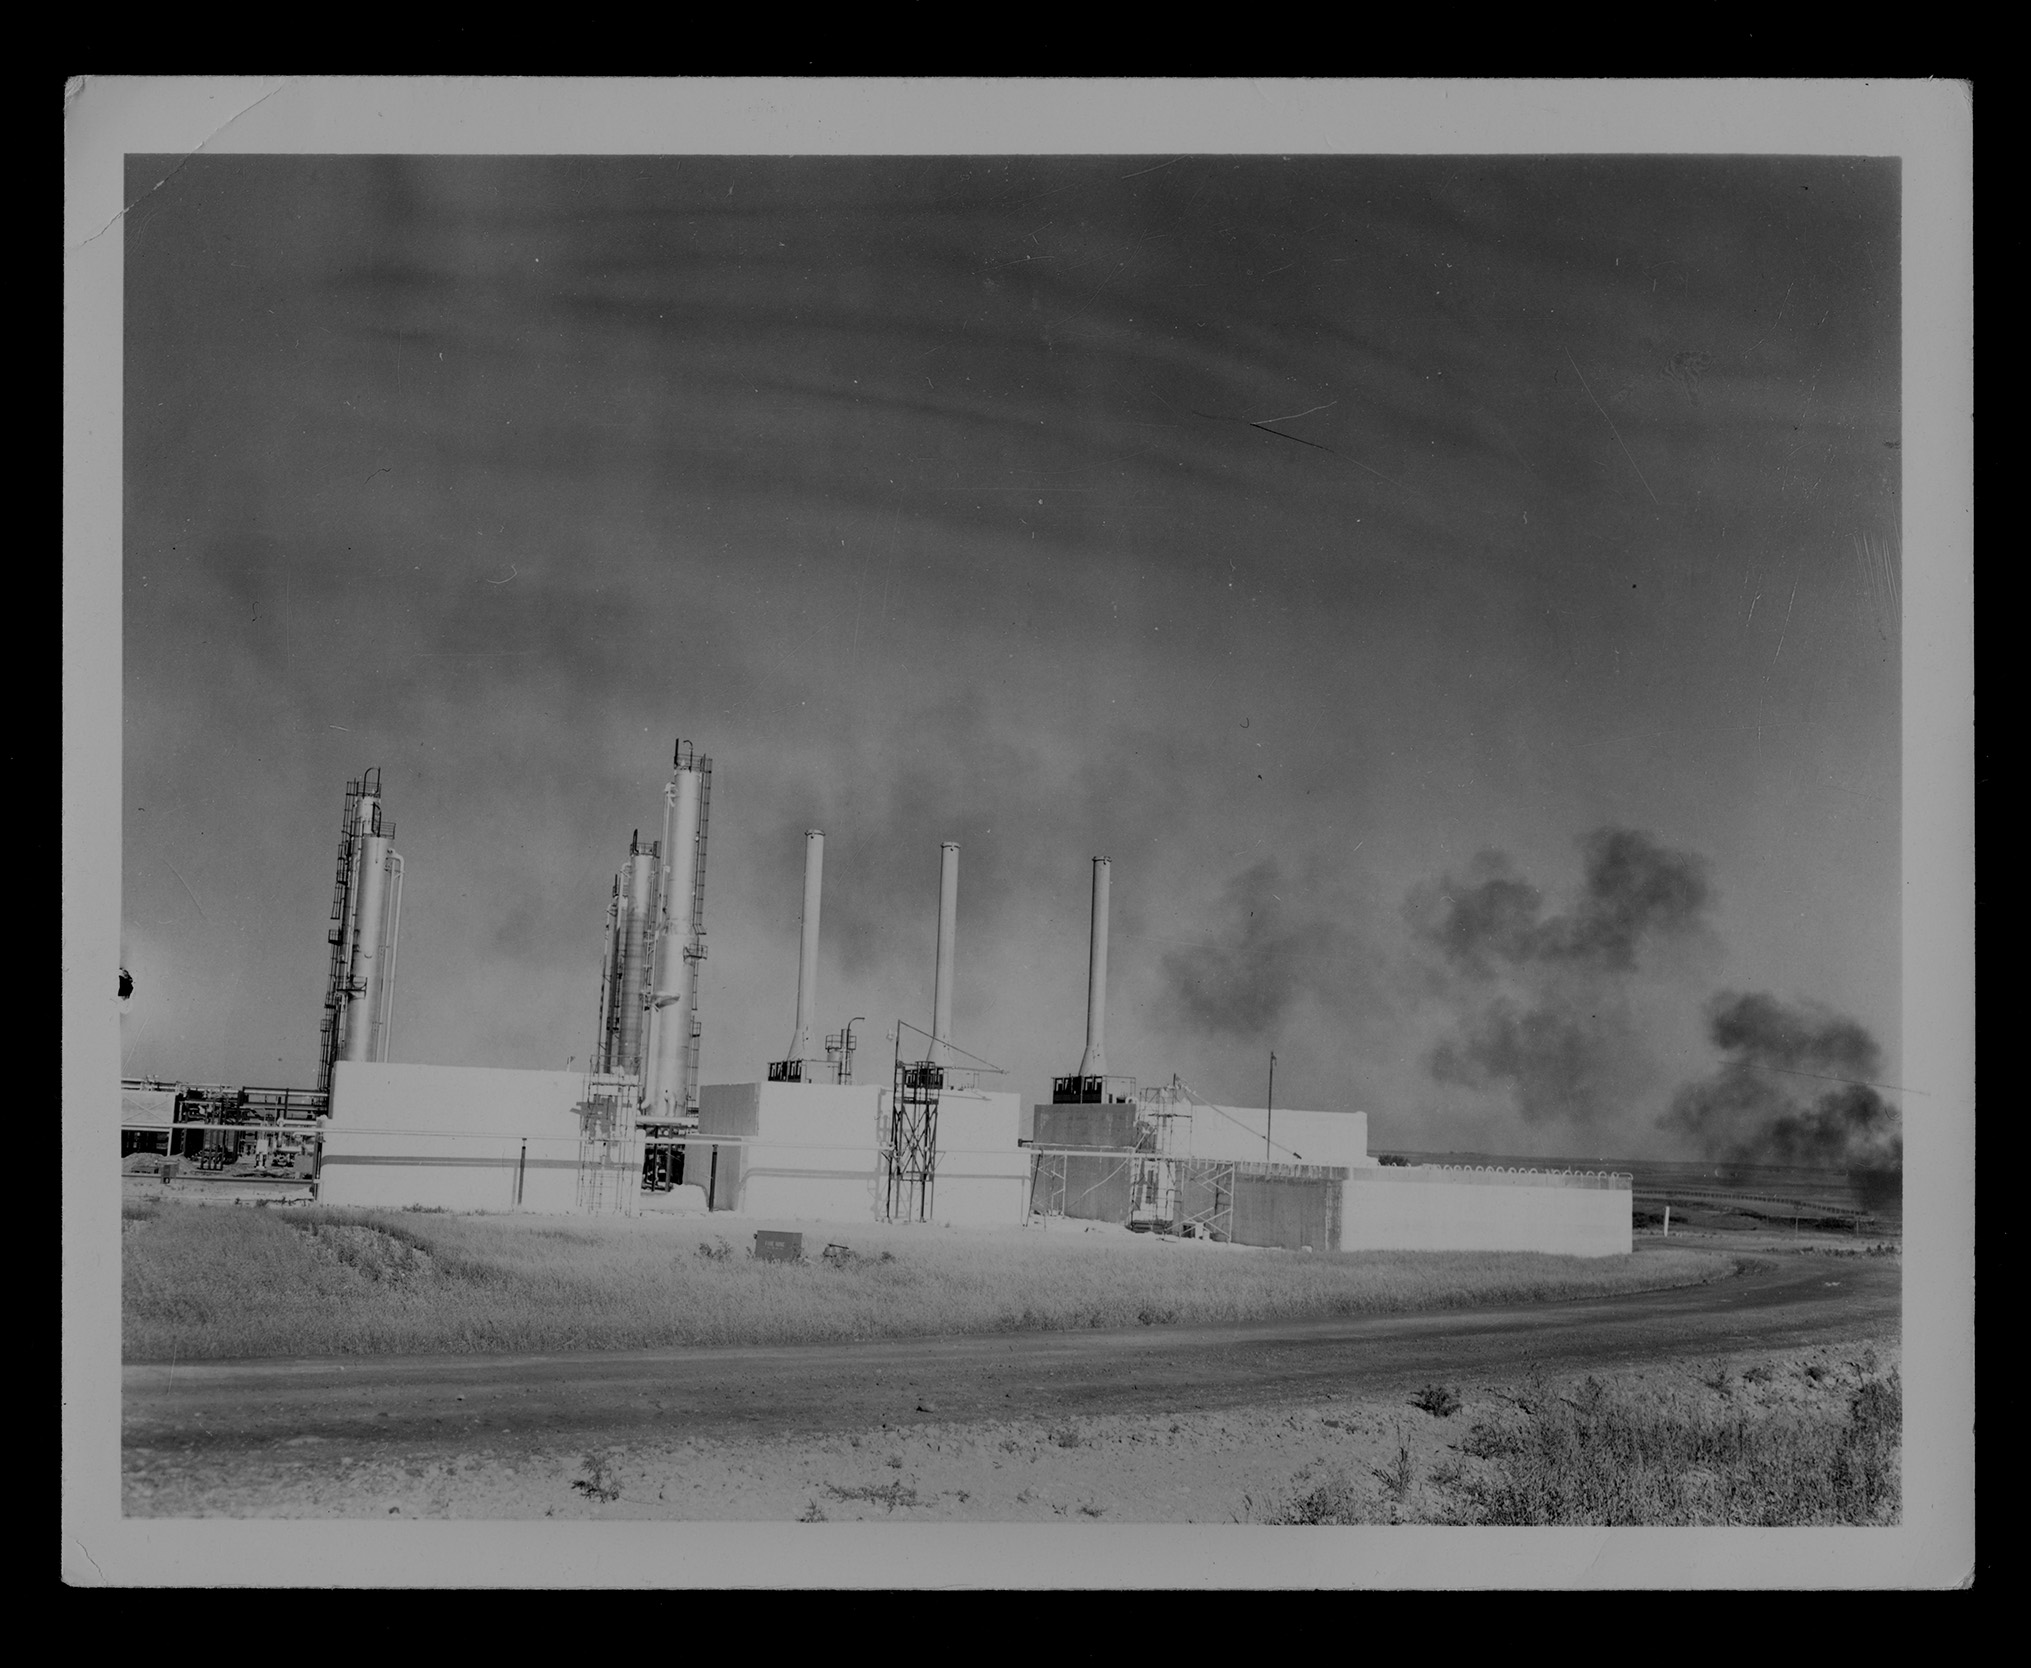
The oil wells spawned other industries and jobs such as oil and gas refineries like this one at Tioga. SHSND #30878-A-0085-55. |
| Source G |
Map of Power Transmission Lines 1946 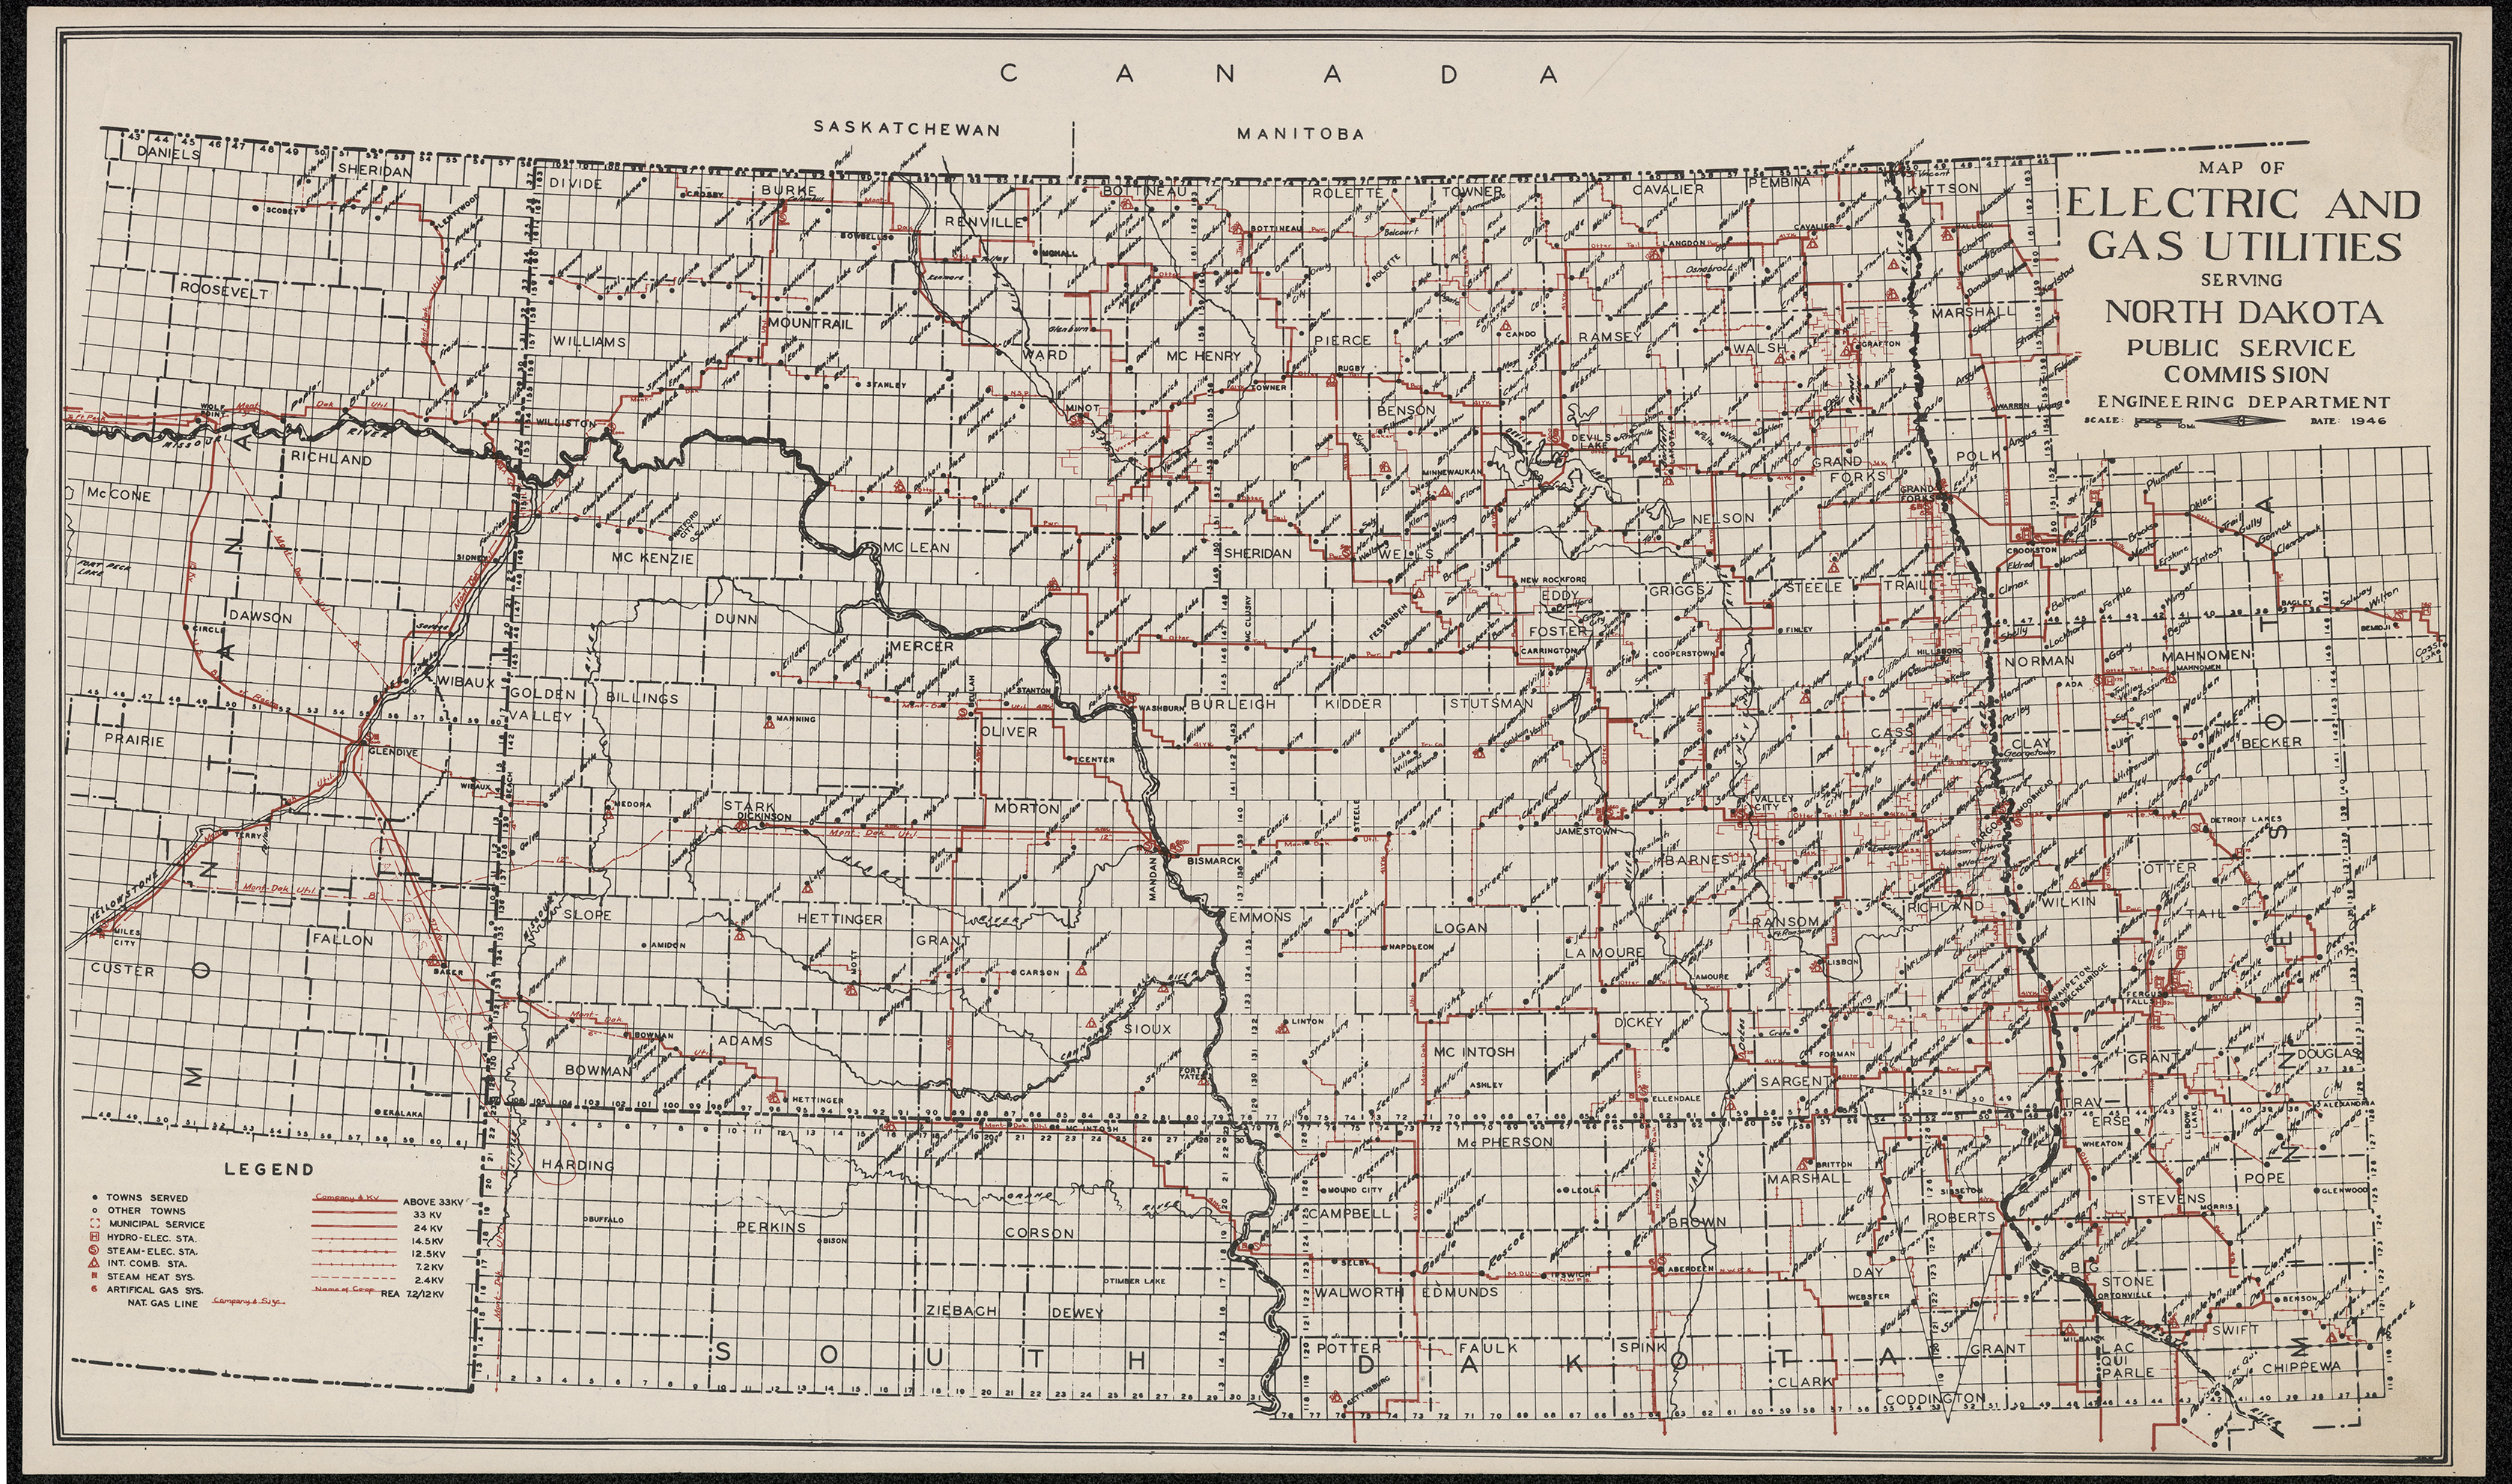
Source: SHSND PSC 333.7932 N864m 1946. This map was published by the Public Service Commission in 1946. It measures 13 by 21 ¾ inches. This 1946 map shows the extension of electric service in North Dakota. Congress passed the Rural Electrification Act in 1935 which created the Rural Electrification Administration (REA). The REA made loans to non-profit organizations, cooperative associations, and public organizations to build power generating plants and power lines to distribute electric power to small towns and farms. In North Dakota, power cooperatives, or co-ops, took the lead in electrifying the countryside. Highlines, or power lines, brought electricity for lighting, refrigeration, motors. Farmers now had electricity to draw water from a deep well as well as safe preservation of food for the farm family. Some farms had built small generating plants which provided limited power, but REA did more to reduce the work load and improve the quality of farm life. Read the map key carefully. Can you determine the names of some of the co-ops? Are they still in business today? What part of the state had the most power lines? Were there any towns that did not have access to highline power at all? What was the most common type of generating plant? Why do are there more hydroelectric generating plants in western Minnesota than in North Dakota? |
| Source H |
Learn more about the history of the energy industry in North Dakota by visiting the North Dakota Heritage Center & State Museum. Learn more about North Dakota oil production at the Oil and Gas Division of the North Dakota Department of Mineral Resources.